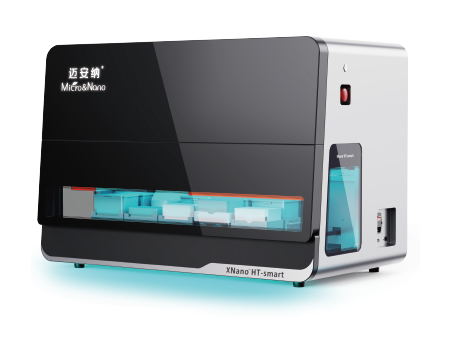
XNano™ HT-Smart
全栈式高通量mRNA/LNP筛选平台
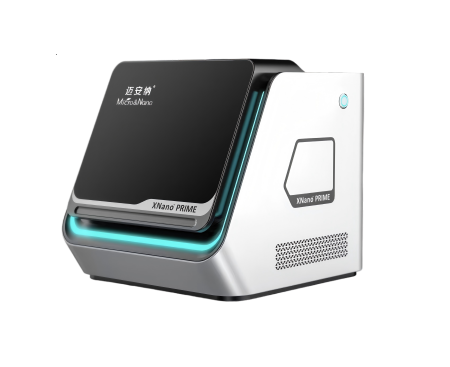
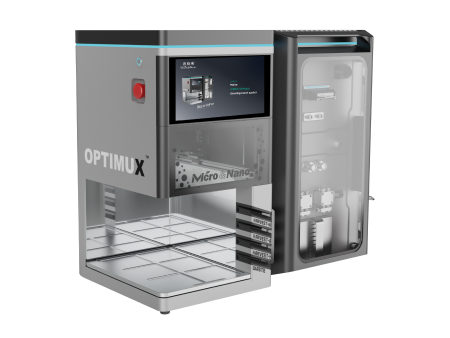
XNano™ Prime
纳米药物筛选制备系统
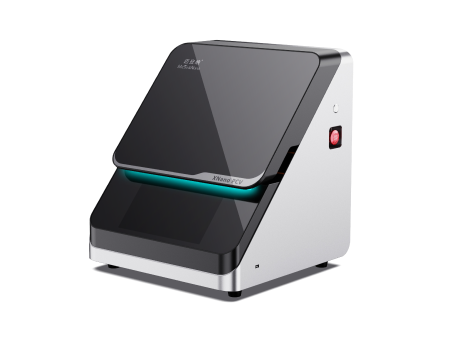
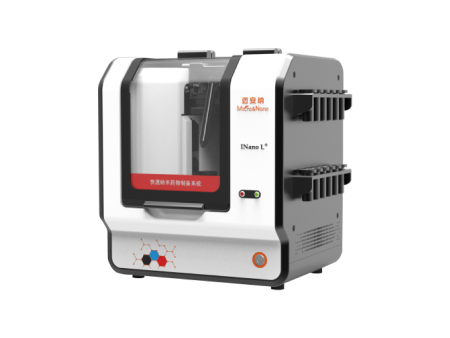
XNano™ PCV
个性化mRNA肿瘤疫苗制造系统
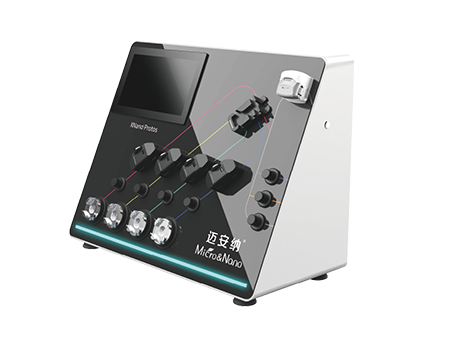
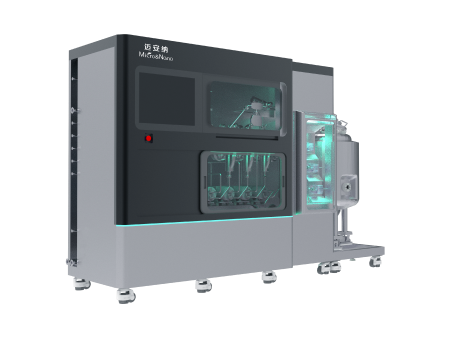
XNano™ Protos
中试/商业化纳米药物连续制造系统(GMP)
高通量mRNA/LNP筛选
抗体-LNP偶联包封服务
RNP-LNP包封
荧光标记LNP合成
常规服务

细胞转染试剂盒
应用试剂盒
器官靶向试剂盒
验证试剂盒
DNA试剂盒
蛋白试剂盒
1.1 材料:
1.2 mRNA-LNP制备:
1.3 切向流过滤与跨膜压(TMP)实验:
1.4 无菌过滤与滤器容量:
1.5 动态光散射(DLS)与Ribogreen分析:
1.6 细胞转染与ELISA分析:
2.1 TMP实验与膜性能:
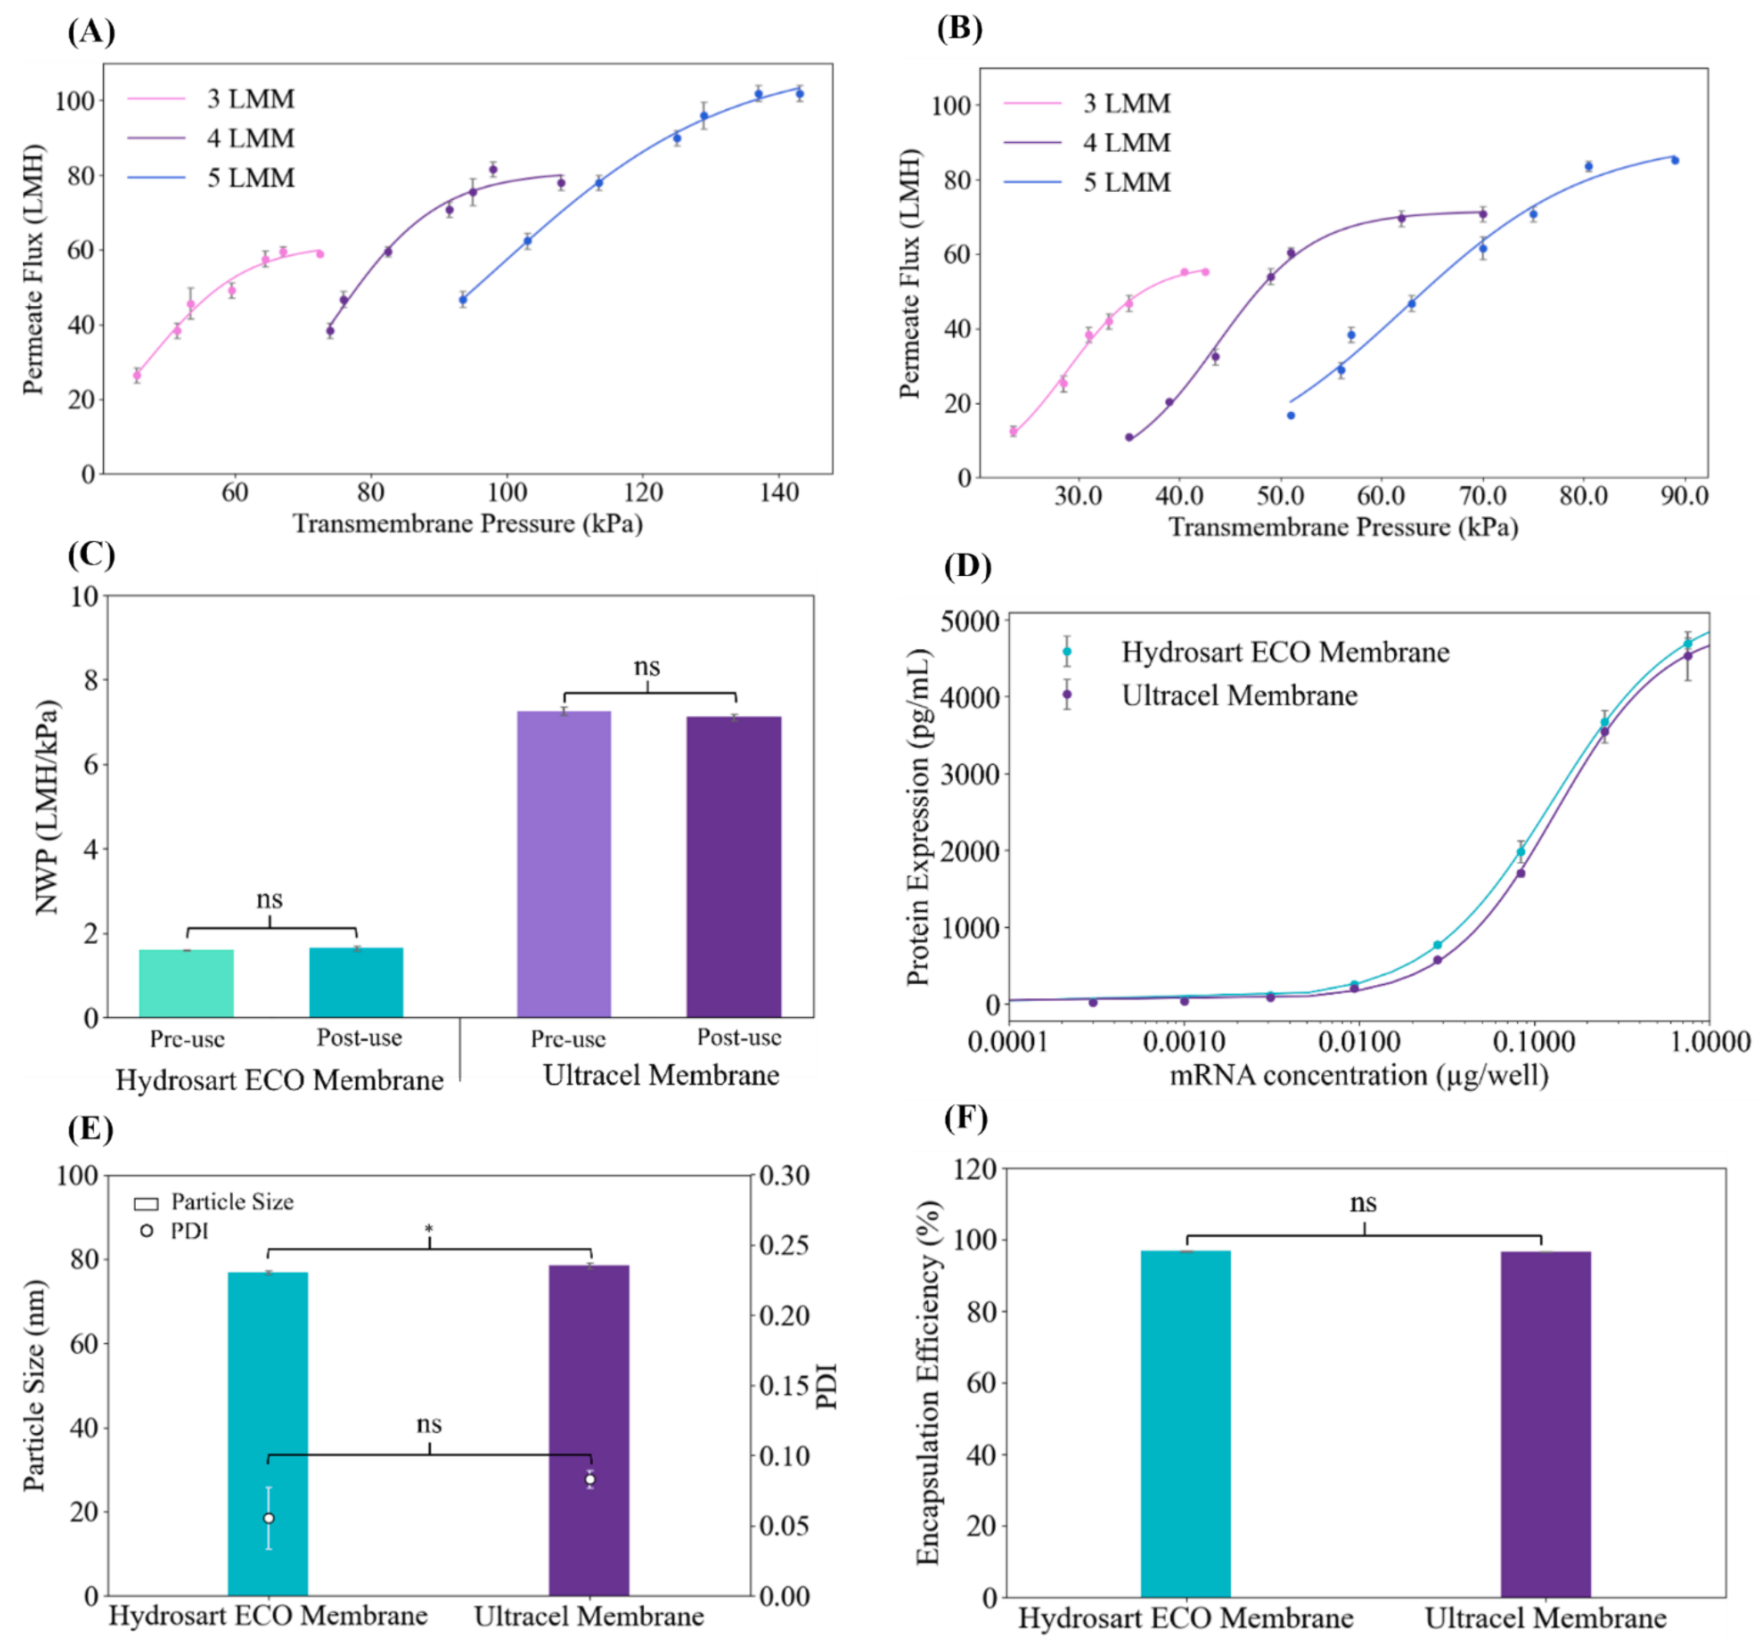
Fig. 1. TMP excursion experiments at various feed fluxes using (A) Hydrosart ECO and (B) Ultracel membranes. (C) Normalized water permeability (NWP) at 22 ◦C before and after TFF processing. (D) Spike protein expression after Huh-7 cells transfection with mRNA-LNPs, fitted with a logistic 4-parameter function. (E) Particle size (nm) and PDI, and (F) encapsulation efficiency of post-TFF samples processed with different membranes.
2.2 过滤模型评估:
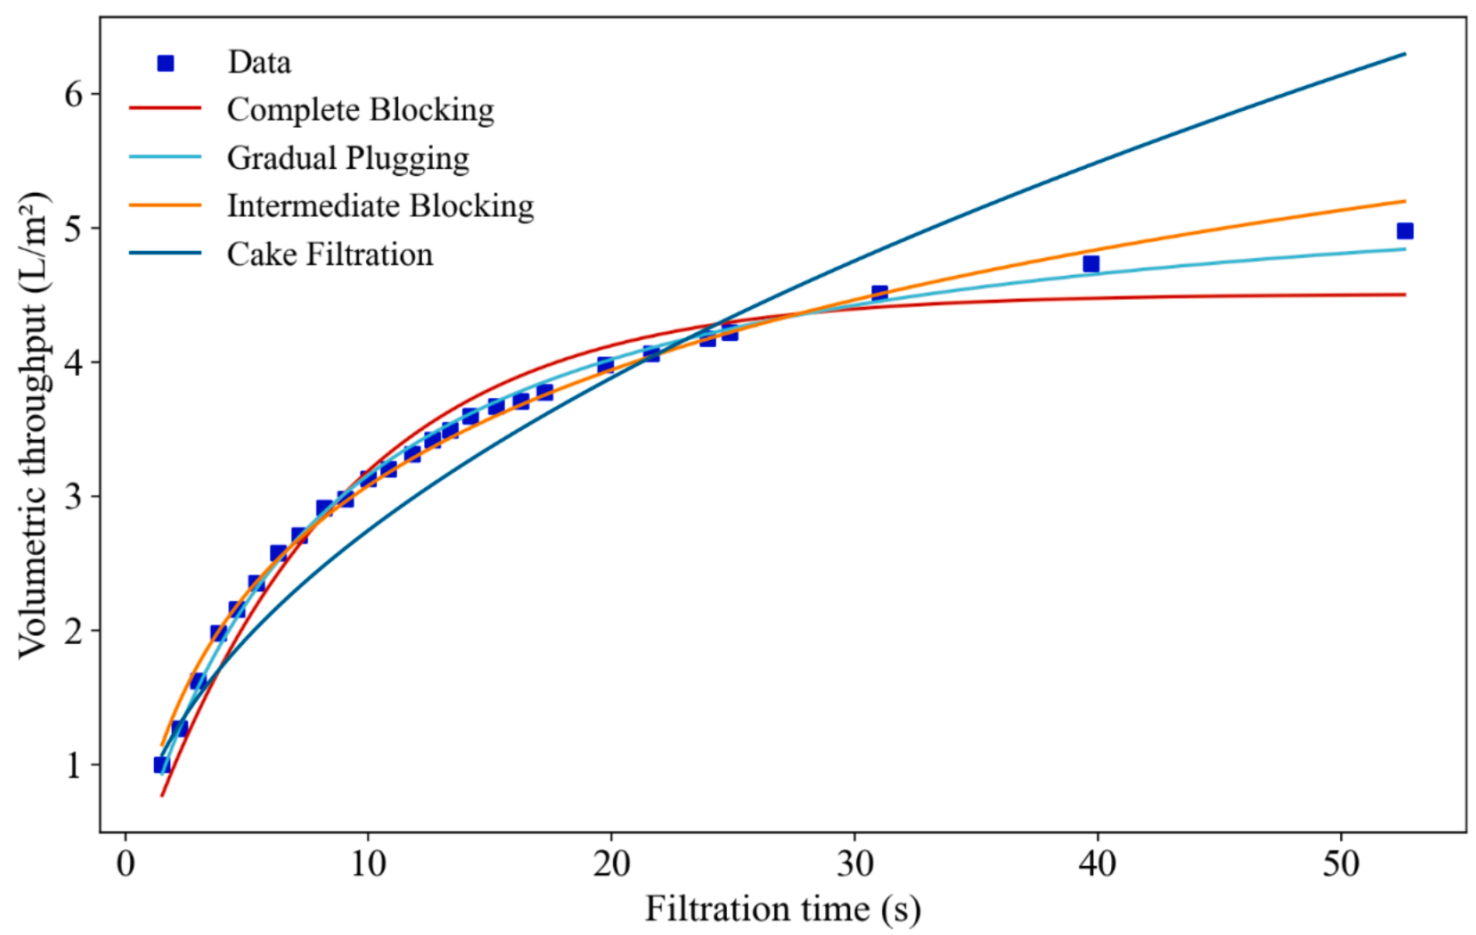
Fig. 2. Volumetric throughput (v) versus filtration time (t) fitting models for mRNA LNPs filtration using Sartopore 2 XLG filter under constant pressure
2.3 滤器筛选:
Table 2 Filter capacity (vmax) and Initial flux (J0) for various filter types at different filtration stages. 1.0 mg/mL mRNA-LNPs filtration was performed at a constant pressure of 68.9 kPa. Refiltration experiments were conducted using a product previously filtered through a Sartopore 2 XLG filter
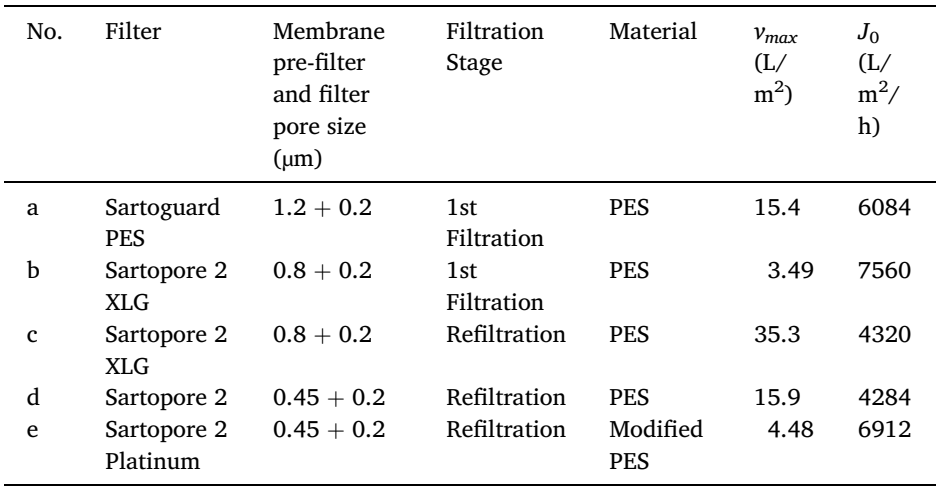
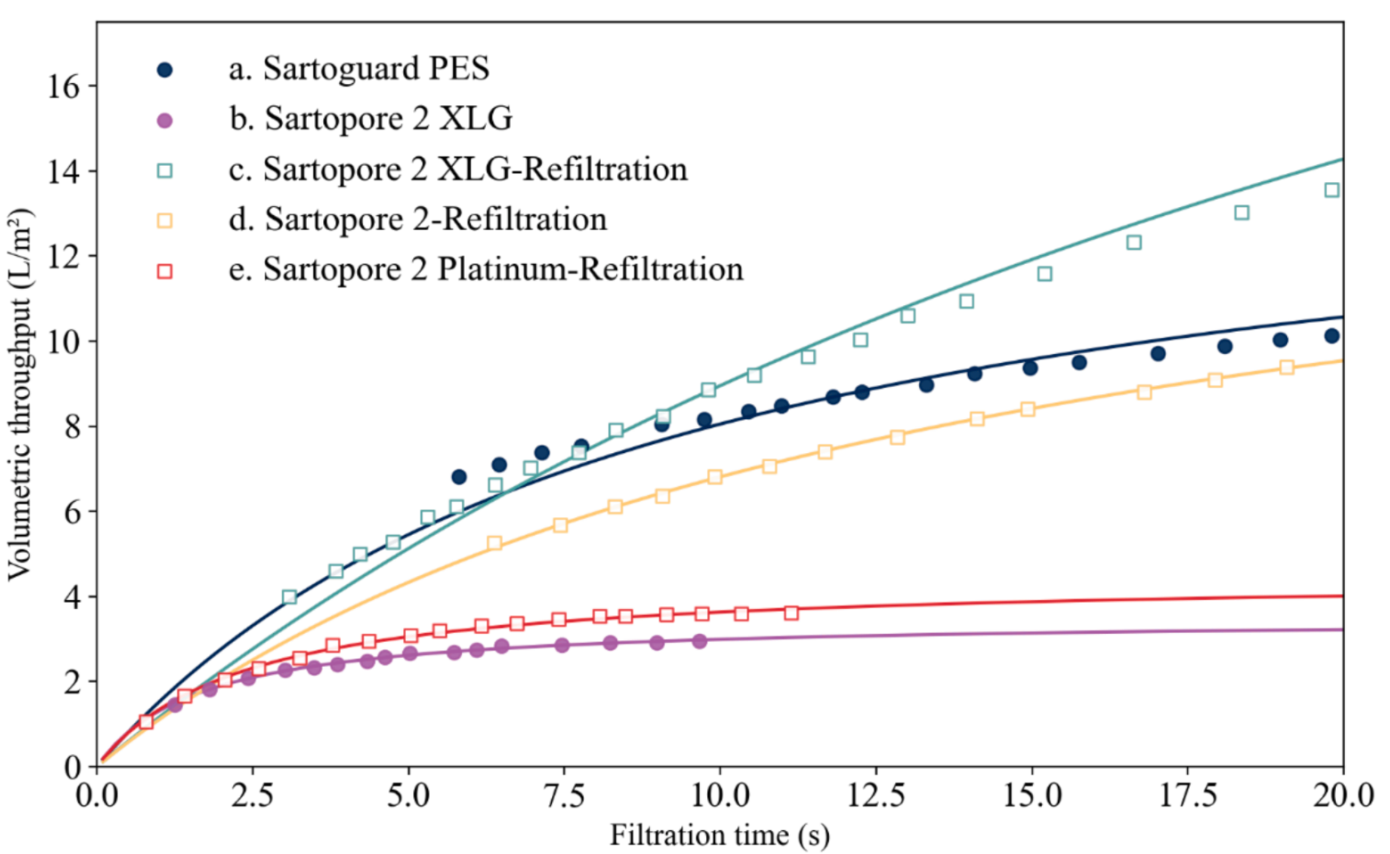
Fig. 3. Plot of volumetric throughput (v) versus filtration time (t) during mRNA-LNP filtration, comparing different filter types and filtration stages. Solid lines represent gradual plugging model fits to the experimental data. Refiltration experiments were conducted using product previously filtered through a Sartopore 2 XLG filter.
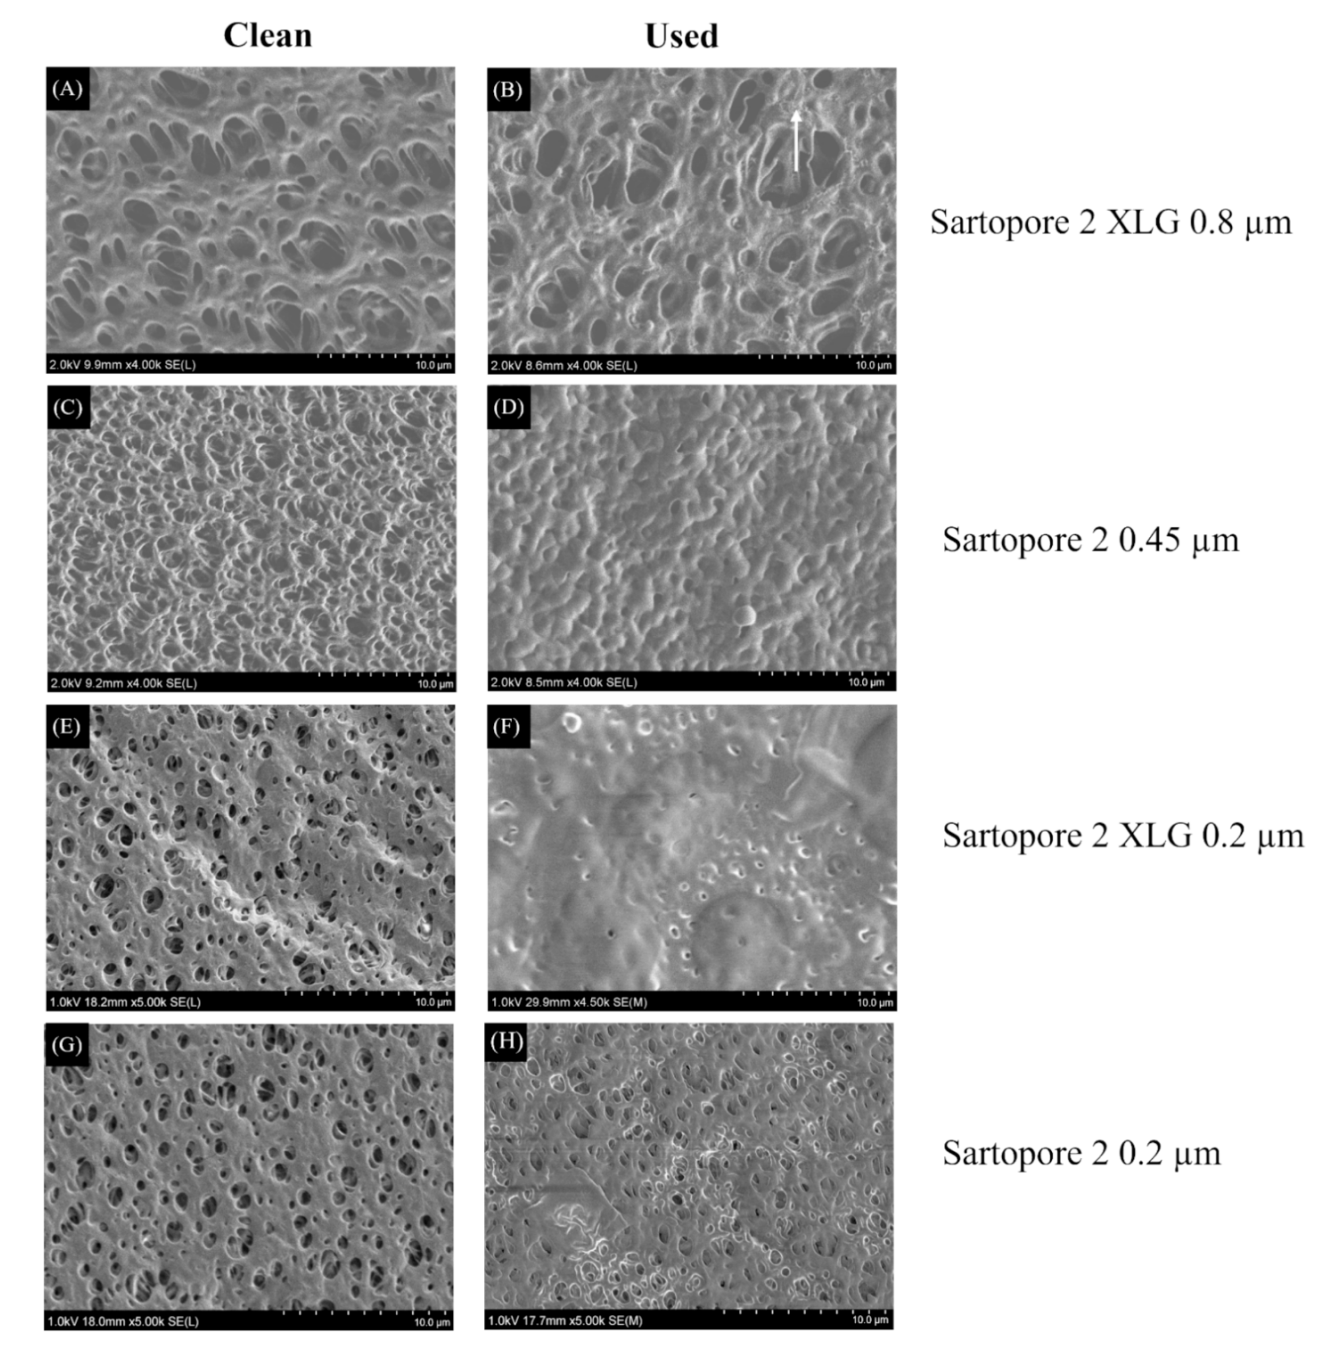
Fig. 4. SEM images of Sartoscale 25 filters used for filtering 1 mg/mL mRNA-LNP drug product: Outlet side of the Sartopore 2 XLG 0.8 µm layer (A) before and (B) after use; outlet side of the Sartopore 2 0.45 µm layer (C) before and (D) after use; inlet side of the Sartopore 2 XLG 0.2 µm layer (E) before and (F) after use; inlet side of the Sartopore 0.2 µm layer (G) before and (H) after use.
2.4 mRNA-LNP浓度对过滤过程的影响:
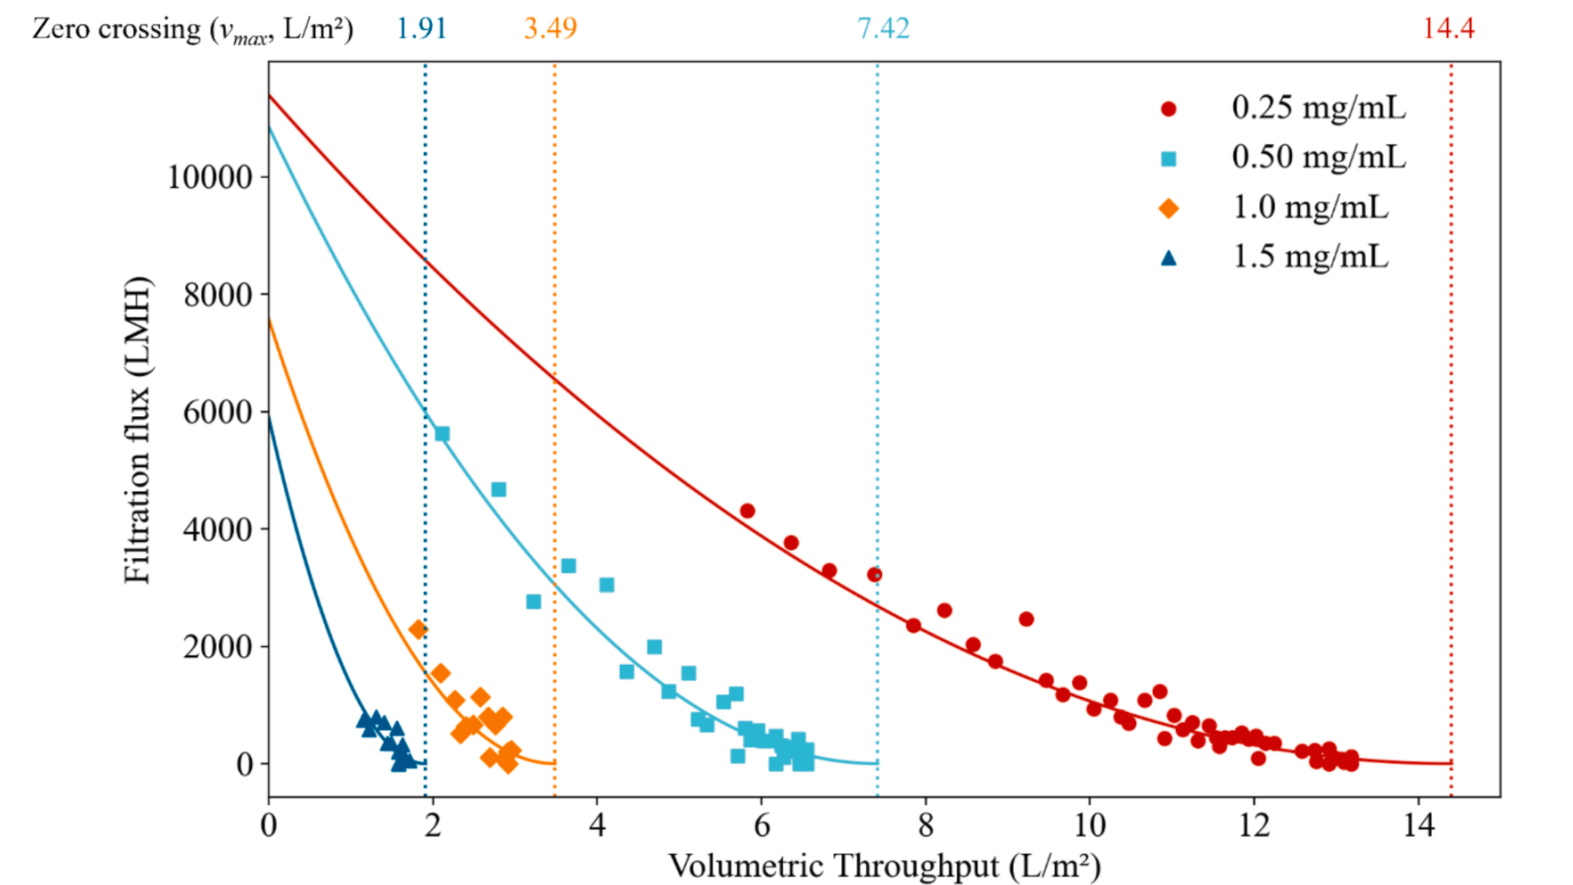
Fig. 5. Filtrate flux (J) versus volumetric throughput (v) of mRNA LNP with various mRNA concentrations using Sartopore 2 XLG under a constant pressure of 137.9 kPa.
2.5 过滤压力对滤器容量的影响:
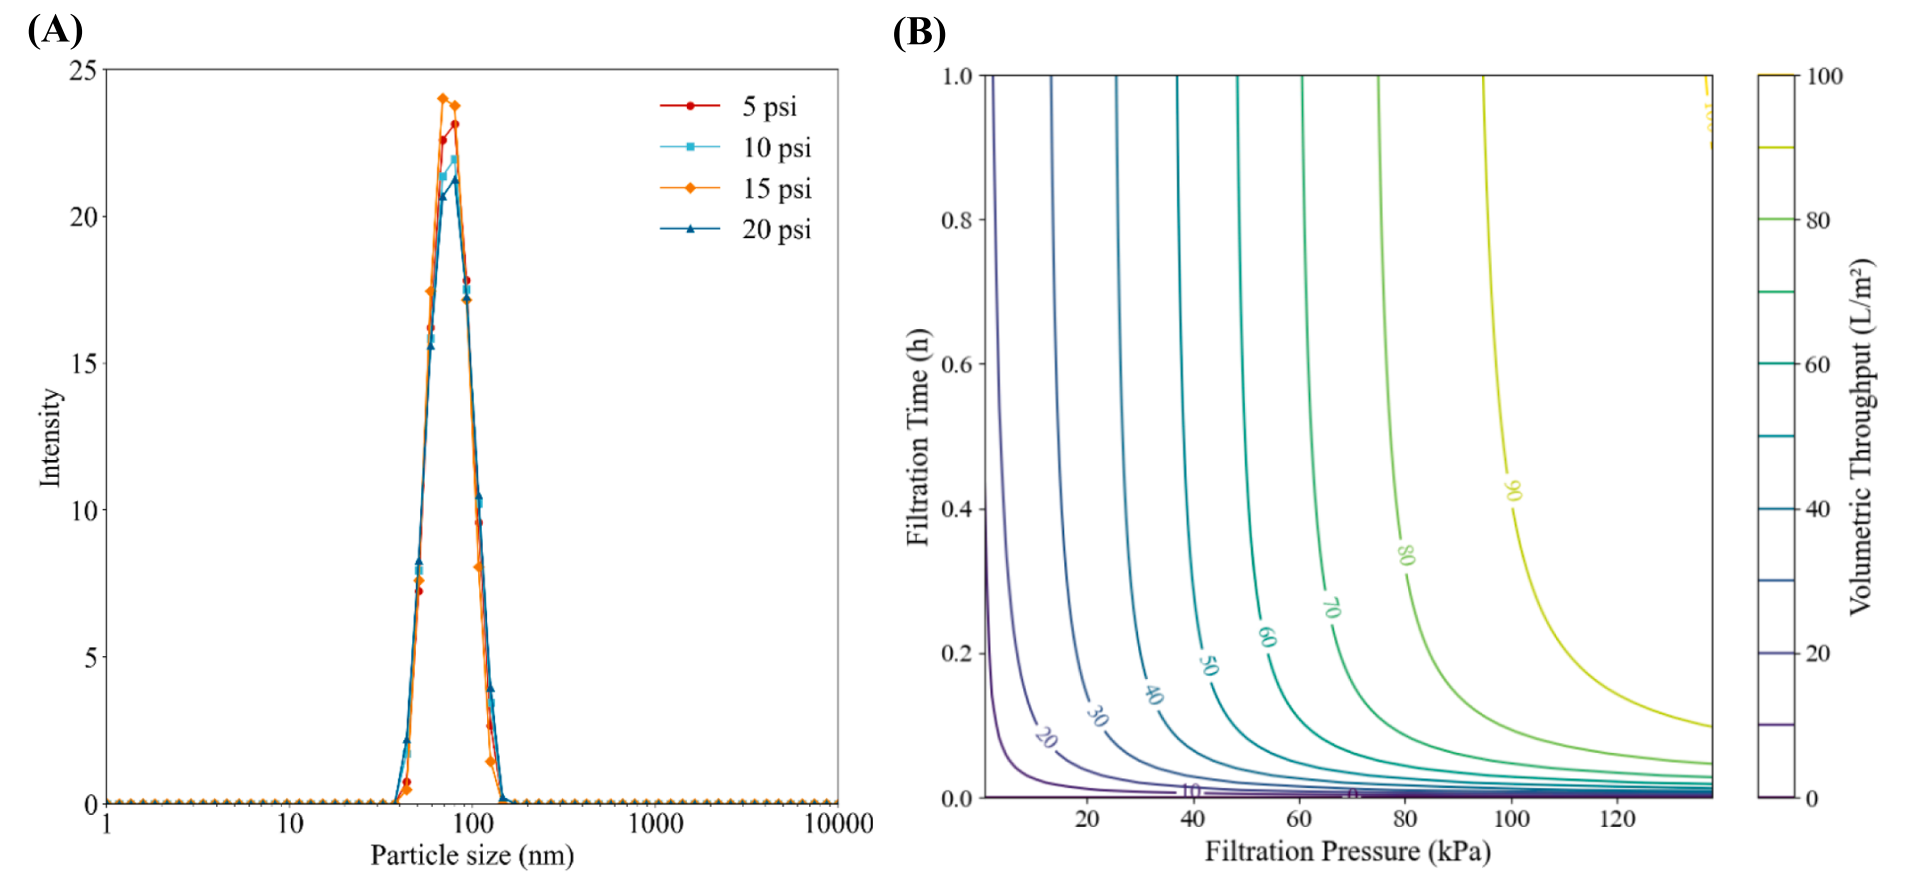
Fig. 6. (A) Particle size distribution graphs by intensity of post-filtration samples at different filtration pressure (B) Contour plot of estimated volumetric throughput (v) as a function of filtration time (t) and filtration pressure (p). The gradual plugging model was extended to v = f (t, p) based on the experimental data, incorporating the effect of filtration pressure.
2.6 最终mRNA-LNP产品表征:
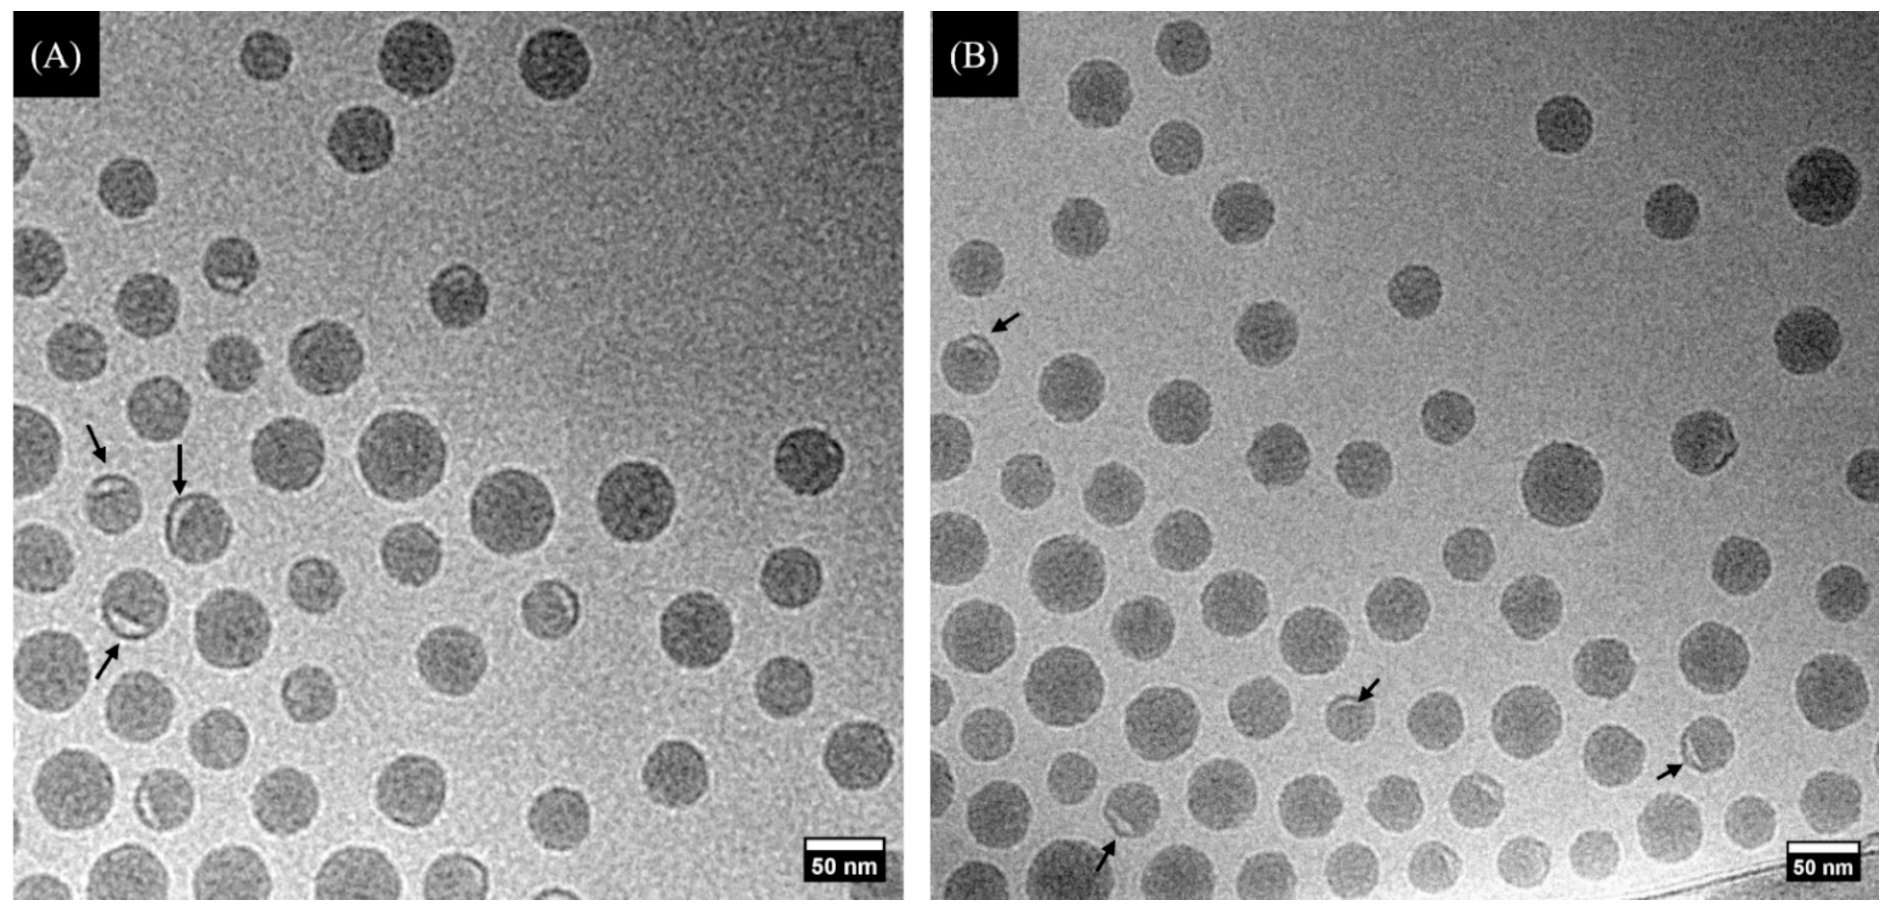
Fig. 7. Cryogenic transmission electronic microscopy (Cryo-TEM) images of mRNA-LNPs after one freeze–thaw cycle (A and B). A few particles show bleb structures (black arrows).
参考文献:Wu, Wenjun, et al. "Process development of tangential flow filtration and sterile filtration for manufacturing of mRNA-lipid nanoparticles: A study on membrane performance and filtration modeling." International Journal of Pharmaceutics (2025): 125520.